
A slow Umbraco platform can spend time in SQL, published-content traversal, Examine, remote dependencies, rendering, background work, allocation pressure or several of these at once. Starting with a favorite fix such as caching usually makes the investigation less reliable.
For the broader set of production techniques to apply once the bottleneck is known, see How to Improve Umbraco Performance.
The rule: do not optimize the component that looks suspicious. Explain the dominant cost first.
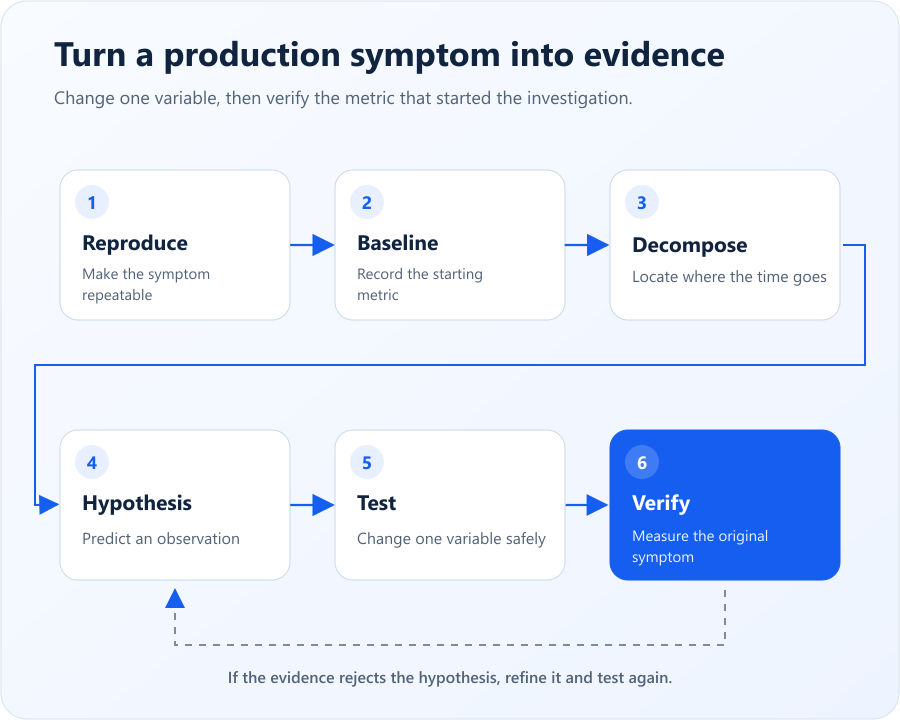
Production diagnostic loop. Move from a falsifiable symptom to evidence, hypothesis, the smallest useful experiment and verification. If the result does not explain the original symptom, loop again.
Start With a Falsifiable Performance Problem
“The Umbraco site is slow” is not yet a diagnostic problem. I want a statement that can be proven wrong: which operation is slow, for whom, under what input or load, how often, and compared with what baseline?
Useful examples are narrower: product pages exceed the normal p95 only for one content branch; publishing a large document type slows after a specific content volume; an import job overlaps with user traffic; or the first request after an application restart behaves differently from steady state.
A precise symptom determines what evidence is worth collecting. Without it, teams gather screenshots, logs and profiler output without knowing what observation would change the decision.
Reproduce or Observe Before You Explain
Reproduction gives control over variables, but production-only problems are common. The requirement is not “make it fail locally.” The requirement is to observe the same symptom with enough context to compare cases.
I record route or operation, representative input, timestamp, environment, relevant content/data volume, user or editor action, application instance where available, and the measured duration. Then I compare a slow case with a healthy case.
Compare slow and healthy paths
A healthy comparison is one of the fastest ways to remove irrelevant hypotheses. If two requests share the same rendering pipeline but only one performs a large search, remote call or broad content traversal, the difference is more informative than a generic CPU snapshot.
Decompose the Latency Before Choosing a Tool
I break the operation into major dependency buckets: application work, SQL, published content or CMS access, Examine/search, external I/O, rendering/serialization and contention from work outside the request.
Layer | Evidence | Question |
|---|---|---|
Application | Trace spans, method timing, allocations | Where does in-process time accumulate? |
SQL | Duration, frequency, rows read, plans | Is database work dominant or merely present? |
CMS/content | Access path, traversal scope, repeated lookups | Is display work using an unnecessarily expensive path? |
Examine | Query timing, index state, result volume | Is search reducing traversal or creating its own bottleneck? |
External I/O | Dependency duration, timeout, concurrency | Is the request mostly waiting? |
Background work | Job timing, resource overlap, queue depth | Is unrelated work creating contention? |
The first useful tool is the one that can separate the largest remaining uncertainty. A profiler is not automatically better than a carefully placed timer if the timer answers the actual question.
Worked example: where did the 2.8 seconds go?
Assume one product route has a p95 of about 2.8 seconds while comparable product pages are around 450 milliseconds. The numbers below are illustrative, but the reasoning is the same on a real incident.
Layer | Observed time | Approx. share | Decision |
|---|---|---|---|
Application work | 2,100 ms | 75% | Decompose this first. |
SQL | 80 ms | 3% | Do not optimize SQL yet. |
External API | 350 ms | 13% | Material, but not the dominant cost. |
Rendering and other work | 270 ms | 9% | Lower priority until the application cost is explained. |
The useful result is not that SQL exists or that the external API takes 350 milliseconds. It is that roughly three quarters of the measured latency is still inside application work. That changes the next question from “how do we make SQL faster?” to “what is the application doing for those 2.1 seconds?”
Typical evidence sources
The exact tooling varies by platform, but the evidence chain often looks like this:
ASP.NET Core request timing → trace/APM spans → dependency timings → SQL or Examine evidence → structured application logs → source inspection
Application Insights, OpenTelemetry-compatible tracing, database diagnostics and targeted timers are examples, not requirements. Use the smallest set of evidence sources that can explain the dominant time.
Use Scale as an Experimental Variable
Many production problems are growth problems disguised as random slowness. I compare behavior across row count, content-tree size, search result volume, request concurrency, payload size or job batch size.
If latency grows roughly with one variable, that relationship becomes a hypothesis. Unbounded retrieval, repeated traversal and per-item remote calls often reveal themselves this way before a full profiler session is necessary.
Ask how cost grows. A query that is fast at 4,000 rows but reads the entire table can still be a production finding because the mechanism predicts future cost.
Example: filtering after materializing the whole dataset
Consider code with this shape:
var history = database.Fetch<SearchHistory>();

var results = history
    .Where(x => x.CreatedDate >= from)
    .ToList();
The important signal is not the syntax. The application retrieves the complete source set before applying the useful filter, so work grows with total history rather than with the result the caller needs. The next investigation is to measure rows read, transfer and duration as the table grows, then move the bound into the database query if the evidence confirms the mechanism.
Example: content-tree work that grows with the site
Request
  → published content
  → broad Descendants traversal
  → repeated by several components
  → cost grows with content-tree size
This is not automatically a performance defect. On a small tree it may be immaterial. The diagnostic question is whether the traversal appears on the affected request path, how often it repeats, and whether its cost changes with the relevant content volume.
Follow the Trace Into the Dominant Dependency
SQL: inspect it when the evidence points to SQL
I look at query duration and frequency, rows read versus returned, repeated queries, pagination, filtering location and execution plans where useful. The presence of SQL is not proof that SQL is the bottleneck. The database must explain a meaningful share of the observed symptom.
Published content and management access are different paths
For public rendering I distinguish published-content access from management operations. I inspect broad traversal, repeated property resolution and code that crosses into management services on display paths. The important question is the runtime cost in the actual path, not whether an API looks unfashionable.
Examine has its own failure modes
Search can replace expensive traversal, but it can also suffer from overly broad indexes, expensive indexing events, large result processing, stale assumptions or repeated queries. I measure it as a dependency rather than treating “use Examine” as a performance answer.
External I/O: measure waiting, timeouts and concurrency
Remote APIs, storage, mail and other dependencies can dominate latency while local CPU remains low. I want dependency timing, timeout behavior, cancellation and concurrency. A fast local method that waits two seconds on a remote system is still a two-second request path.
Look Outside the Request
Not every slow request is caused by code executing inside that request. Background jobs, imports, indexing, deployment activity, database maintenance, memory pressure and shared infrastructure can create contention.
This matters especially for intermittent slowness. I correlate spikes with scheduled work, resource saturation, garbage collection, database pressure, instance changes and external dependency behavior. Time correlation is not proof, but it narrows the next experiment. A concrete example is webhook polling exposed while working with 805K documents, where background SQL activity was visible only after looking beyond the foreground operation.
Intermittent slowness needs correlation, not averages
Averages can hide the exact requests users complain about. Percentiles and individual traces are more useful when only a fraction of traffic is affected. I preserve the slow sample and compare it with a healthy sample from the same period.
Turn Evidence Into a Hypothesis That Predicts Something
A useful hypothesis predicts an observation before the change is made. “Caching might help” is weak. “This request repeats the same expensive content traversal six times; removing five traversals should reduce application time by approximately the repeated cost while SQL and external timings remain unchanged” is testable.
Predictions protect the investigation from confirmation bias. If the expected observation does not occur, I revise the explanation rather than declaring victory because one metric moved.
Continue the worked example
Suppose the 2.1 seconds of application work resolves to the same broad published-content traversal being performed by several components. A useful hypothesis is: repeated traversal explains most of the branch-specific latency.
The prediction is equally important: if the required content is resolved once and reused during the request, application time should fall substantially while SQL and external dependency timings remain broadly unchanged. If SQL suddenly changes instead, or the request remains near 2.8 seconds, the explanation was incomplete.
Change the smallest thing that tests the hypothesis
I prefer a narrow experiment over a broad optimization branch. Bound the query, bypass one dependency, remove one repeated traversal, change one batch size, or isolate one background job. Small changes preserve causal information.
Verify the Original Symptom, Not a Proxy
A lower SQL duration is not enough if the user-visible request remains slow. Lower CPU is not enough if publishing still blocks editors. A faster microbenchmark is not enough if production p95 does not move.
I rerun the original scenario under comparable conditions and compare the same end-to-end measure. Then I check for regressions, cache invalidation issues, increased load elsewhere or a new tail-latency problem.
Optimization is complete only when the original symptom improves for the reason the hypothesis predicted.
In the illustrative example, a result such as p95 falling from roughly 2.8 seconds to 700 milliseconds is meaningful only if the trace also shows the predicted reduction in repeated application work. The exact number is not the lesson. The causal chain is.
Publishing and Rendering Need Different Dependency Maps
The scientific method is the same, but the paths are not. Public rendering typically emphasizes published content, search, data access, integrations and response generation. Publishing can involve validation, notifications, persistence, indexing, cache refresh, custom events and editor-side behavior.
I therefore build a separate latency decomposition for publishing rather than applying request-path assumptions to the backoffice. This is particularly important on large content estates where indexing or downstream handlers can dominate editor-visible time. The 325K-node slow-publishing case study shows why publishing needs its own dependency map instead of being treated as a slow page request.
Know When to Stop Investigating
I stop when the evidence is strong enough to make the next engineering decision, the remaining uncertainty cannot change that decision, or the next diagnostic step costs more than the plausible risk it could remove.
This prevents performance work from turning into open-ended curiosity. The goal is not a perfect model of the system. The goal is enough explanation to choose and verify the next action.
Keep an Evidence Trail
A useful investigation should be reproducible by another engineer. I keep the symptom, baseline, slow and healthy samples, decomposition, observations, rejected hypotheses, chosen experiment, result and verification together. If the evidence starts exposing risks outside the original performance symptom, I widen the scope using the evidence-to-decision approach in How I Audit an Umbraco Project.
Record | Example |
|---|---|
Symptom | Product route is around 2.8 s p95 while comparable routes are around 450 ms (illustrative). |
Evidence | Trace attributes roughly 2.1 s to application work and repeated broad traversal dominates that time. |
Hypothesis | Repeated traversal explains the branch-specific latency. |
Experiment | Resolve the required data once and reuse it in the request. |
Prediction | Application time falls while dependency timings remain stable. |
Verification | Original route and p95 improve under comparable conditions. |
Diagnostic Checklist
Define one falsifiable user-visible symptom.
Capture a baseline and a healthy comparison.
Decompose latency before selecting an optimization.
Test whether cost grows with data, content, traffic or concurrency.
Follow evidence into SQL, CMS/content, Examine or external I/O.
Correlate intermittent slowness with work outside the request.
Write a hypothesis that predicts an observation.
Change the smallest useful variable.
Verify the original symptom under comparable conditions.
Record rejected hypotheses and the final evidence trail.
Final Perspective
Production performance work is strongest when it behaves like diagnosis rather than tuning. Start with a symptom precise enough to falsify. Decompose the latency. Follow the evidence into the dominant dependency. Make a prediction, test the smallest useful change, and verify the same symptom again.
Tools can accelerate every step, but they do not replace the questions. The durable skill is knowing what observation would prove the current explanation wrong.
Frequently Asked Questions
Do you need APM to diagnose Umbraco performance?
No. APM can shorten the path to evidence, but the method does not depend on one product. Request timings, structured logs, database measurements, traces, controlled reproduction and source inspection can be enough if they answer the right questions.
What should I measure first on a slow Umbraco site?
Start with the user-visible symptom and decompose its latency. Measure the request or operation end to end, then isolate time spent in application code, database work, published content or search, external dependencies and background contention.
What if the issue cannot be reproduced outside production?
Treat production as an evidence source rather than forcing a false local reproduction. Use safe telemetry, correlation, traces, representative inputs and controlled comparisons. Avoid intrusive diagnostics that could create a second incident.
Is slow publishing diagnosed the same way as slow page rendering?
No. The same scientific method applies, but the dependency graph differs. Publishing can involve validation, notifications, indexing, persistence, cache refresh and editor-side behavior, while rendering follows the public request path.


