
A page can be slow because of published-content access, SQL, Examine, external APIs, background contention, media delivery, browser work or several of them at once. The practical job is to identify which part of the system is failing a requirement and change the mechanism that explains it.
Performance is a system property. Optimize the execution path that is actually expensive, not the component that is easiest to blame.
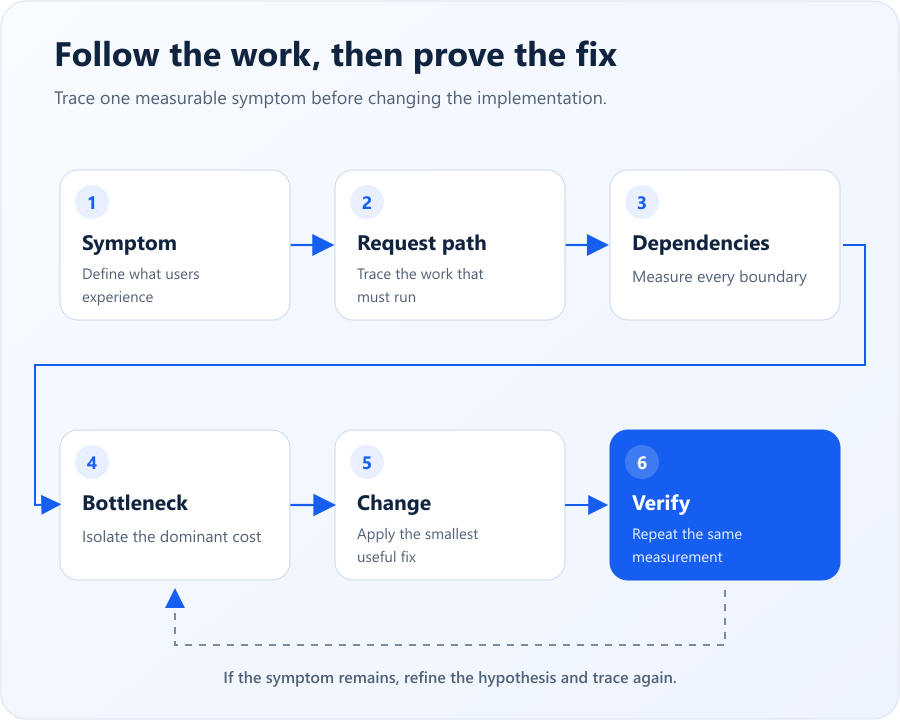
Umbraco performance is an end-to-end system path. Public and editorial operations cross several layers. The dominant cost can sit in the CMS, custom application code, data, integrations, infrastructure or the browser.
Start With a Performance Requirement, Not an Optimization
“The site is slow” is too broad to engineer against. I first define the operation and the requirement: public page response, search, save, publish, import, scheduled job or client-side interaction. I separate cold-start behavior from steady state and median behavior from tail latency.
For a public route I may record server duration, TTFB and user-facing browser metrics. For editorial work I record save, publish, search or tree-operation duration. At the same time I capture request rate, CPU, memory and dependency timing so a latency spike can be interpreted in context.
Symptom | First useful question | Likely evidence |
|---|---|---|
Slow first HTML | Where does server time go? | Request traces, dependency timings, SQL/search evidence |
Fast HTML, slow page experience | What delays rendering or interaction? | LCP/INP, network waterfall, media and script cost |
Slow publishing | Which publishing dependency grows? | Handlers, indexing, persistence, notifications, job timing |
Intermittent spikes | What else happens at the same time? | Background jobs, resource saturation, external dependencies |
The baseline is what prevents a team from “improving performance” without proving that the original requirement changed.
Follow the Critical Path Before You Change the System
For a slow operation I trace the work that must complete before the user gets the result. A public request that performs a published-cache lookup, a bounded projection and rendering has a different risk profile from one that traverses a large tree, opens several database queries and waits for two remote APIs.
For each dependency I ask: does this work have to happen now, and does it have to happen every time? Expensive work that is both synchronous and repeated is where architecture and performance often meet.
This also exposes accidental coupling. A helper may hide database access. Several components may repeat the same content traversal. Personalization may turn an otherwise cacheable page into request-specific work. The critical path makes these costs visible as one system.
Keep Published Reads on the Published Content Path
Umbraco distinguishes management operations from published-content access. Code serving public pages should normally use the published representation rather than treating management services as a generic read repository.
This is not a rule that management services are “bad.” Publishing workflows, imports, migrations and administration legitimately need them. The performance smell is management access leaking into a hot display path whose job is to serve published content efficiently.
Measure repeated content work as well as the API choice
Using the right published API is not enough if the application repeats broad work several times per request. I inspect traversal scope, repeated property resolution and whether several partials independently reconstruct the same data.
Treat Content Traversal as an Algorithm
Calls such as descendants, ancestors and sibling scans are not automatically problematic. Their cost depends on the size of the traversed set, how frequently the operation runs and whether the result is recomputed.
The useful question is: how many nodes can this operation touch in the largest realistic tree, and how often? A bounded traversal of a small navigation branch can be perfectly reasonable. A site-wide traversal on every request deserves evidence and usually a more selective retrieval strategy.
Request
  → published content
  → broad Descendants traversal
  → repeated by several components
  → work grows with content-tree size
The content tree should represent editorial structure. It should not accidentally become the application's query engine for every large collection.
Use Examine When the Retrieval Problem Is Search
Examine is a strong fit when the application needs selective queries across a large published corpus. It can avoid repeated broad tree traversal and gives the system an index designed for retrieval.
Moving work to Examine does not automatically make it efficient. I verify query selectivity, result limits, fields, analyzers, index freshness requirements and what happens after results return. A search that materializes thousands of items only to discard most of them in application code is still an unbounded retrieval problem.
Choose the retrieval model that matches the question. Tree navigation, indexed search and relational queries solve different shapes of problem.
Make Database Work Proportional to the Result
One of the clearest performance failure patterns is loading a large dataset and filtering it in memory. It often looks harmless while the table is small and becomes expensive only after years of growth.
var history = database.Fetch<SearchHistory>();

var results = history
    .Where(x => x.CreatedDate >= from)
    .ToList();
Here the application retrieves the complete source set before applying the useful bound. Memory, transfer and application CPU grow with total history even if the caller needs only a small subset.
When SQL is the correct source, push filtering, projection, ordering and limits into the database. Inspect generated SQL, rows read, execution plans and indexes when evidence points there. Do not perform “database optimization” as a ritual if traces show SQL contributes only a small fraction of end-to-end latency.
Give External Integrations a Latency Budget
A remote dependency on the request path is part of page latency whether or not local code is fast. I want normal latency, timeout, retry behavior, failure semantics and whether the result can be cached, prepared asynchronously or removed from the critical path.
A 150 ms dependency called four times sequentially already consumes 600 ms before rendering and other work. Retries can improve resilience for transient failures, but retries on a synchronous request can also multiply latency and traffic during an outage.
Once a dependency is on the critical path, resilience policy and performance policy are the same architecture conversation.
Control Background Work Before It Controls Foreground Latency
Scheduled jobs, imports, indexing, publishing bursts, image processing and queue consumers compete for CPU, memory, database connections and locks. A background task that loads an entire table every few minutes can degrade public traffic without appearing anywhere in the page code.
I inventory recurring work by schedule, duration, data volume, concurrency and failure behavior. Work should be proportional to what changed where practical. Large workloads are usually easier to operate when they are bounded through batches, checkpoints and explicit concurrency limits rather than one opaque sweep.
For intermittent slowness, correlate request spikes with job execution, indexing, deployments, garbage collection, database pressure and remote dependency behavior. Averages often hide this relationship.
Cache Only After You Understand the Miss Path
Caching is powerful because it avoids work. It can also hide a structurally poor path. If a request takes two seconds because it performs an unbounded query, a ten-minute cache may make most requests fast while preserving a dangerous miss path during deployment, purge or traffic spikes.
I first identify the expensive work, then decide whether to remove it, bound it, precompute it or cache it. The cache decision includes freshness, invalidation, key cardinality, memory pressure, multi-instance behavior and stampede risk.
Edge caching is an architectural decision too
CDN caching can be extremely valuable for public pages and static assets when cacheability semantics are clear. Authentication, personalization, preview behavior and invalidation rules need to be understood before increasing TTLs.
Separate Origin Performance From Browser Performance
A fast origin can still deliver a slow experience. Oversized images, render-blocking CSS, unnecessary JavaScript, third-party tags and poor font loading can dominate LCP or interaction time. Conversely, a perfect frontend audit cannot repair a two-second TTFB caused by server work.
I keep server and client evidence separate, then connect them through the user journey. Serve image dimensions appropriate to the rendered slot, avoid unnecessary blocking work, and make critical resources discoverable early.
This separation prevents teams from improving Lighthouse details while the dominant server bottleneck remains untouched, or scaling the server when the real problem is client-side payload.
Treat Infrastructure as Evidence, Not the Default Scapegoat
Hosting size, region, database tier, network topology, CDN configuration and load balancing all matter. But scaling infrastructure before identifying the workload can convert an architecture problem into a larger monthly bill.
I compare saturation with request timing. If CPU is low while requests wait on a remote service, more CPU is unlikely to help. If CPU, memory, connections or throughput are demonstrably saturated by legitimate bounded work, infrastructure may be exactly the right lever.
For multi-instance Umbraco environments, performance changes must also preserve supported deployment, cache and backoffice behavior. Making one instance faster while creating inconsistent state is not an optimization.
Large Platforms Reveal Growth-Sensitive Failure Modes
Scale changes which mistakes become visible. A content traversal that is effectively free on a brochure site can dominate a request when the same pattern touches hundreds of thousands of documents. The same is true for polling, indexing and whole-table retrieval.
I record the scaling variable for important paths: nodes traversed, rows read, results materialized, external calls, media variants or jobs per unit of time. This turns “it gets slow at scale” into a mechanism that can be tested.
In one large platform with more than 805,000 documents, SQL profiling exposed webhook polling that was unnecessary for the deployment model. The useful lesson is not the document count itself. Large scale amplified background work enough to make a hidden mechanism measurable.
In another production path, retrieving a full history table before filtering created cost that grew with total history rather than with the requested result. Both cases point to the same engineering principle: make work proportional to the result or change that actually matters.
Give Editors Their Own Performance Budgets
Public latency gets most of the attention, but editor performance determines part of the operating cost of a content platform. Slow save, publish, search and tree operations create a tax paid repeatedly by every editor.
I establish separate expectations for editorial operations because their dependency paths differ from public rendering. Publishing may involve validation, persistence, notifications, indexing, cache refresh and custom handlers. Backoffice search may depend on different indexes and result shapes.
If publishing time grows sharply with unrelated content elsewhere in the tree, that is an architectural signal. If the backoffice is healthy except during imports, that points toward contention rather than generic “Umbraco slowness.”
Know What Not to Optimize
I do not optimize code simply because a profiler can identify a slowest method. Every application has one. I care about work that is slow enough, frequent enough or variable enough to affect a requirement.
A 20 ms operation called once during startup is a different problem from the same operation executed fifty times per request. I also avoid replacing clear code with clever micro-optimizations before system-level costs are understood. Database round trips, network waits, broad retrieval and repeated rendering work usually dominate tiny allocation differences.
Once the architecture is healthy and the workload justifies deeper tuning, micro-level optimization can be appropriate. It should come from profiling and a measurable budget, not taste.
Verify With the Workload That Exposed the Problem
Every material optimization needs a before-and-after comparison under a representative workload. Repeat the same routes, data volumes and operational conditions where possible, and compare the same end-to-end requirement.
Also verify correctness, freshness and failure behavior. A cache that returns stale content faster is not successful when freshness matters. A faster import that overwhelms the database during business hours is not a system improvement.
The strongest performance work leaves behind more than a faster endpoint. It leaves a measurable budget, useful telemetry and a clearer model of healthy behavior.
A Practical Order of Operations
Define the failing requirement. Name the route, operation, workload and metric.
Capture a baseline. Include latency, dependencies, resource use and relevant scale.
Trace the critical path. Identify synchronous and repeated work.
Find the dominant cost. Separate content, search, SQL, remote I/O, background work, infrastructure and browser cost.
Check how the cost scales. Nodes, rows, results, calls, concurrency or payload.
Change the mechanism, not the symptom. Bound, remove, move, precompute, cache or scale only when the evidence supports it.
Verify the original requirement. Repeat the workload and check for correctness and operational regressions.
This order is deliberately boring. It prevents folklore-based optimization and makes each change explainable.
Final Perspective
Good Umbraco performance is not the absence of expensive operations. Real systems perform expensive work. The goal is to put that work in the right place, execute it at the right frequency, bound it with the right data model and make its cost observable.
When a platform becomes slow, start with the requirement and the path. The CMS is only one layer. The dominant cost may be published content, custom code, SQL, search, an integration, background work, infrastructure or the browser. Strong performance engineering distinguishes those mechanisms before prescribing a fix.
Frequently Asked Questions
What should I measure first on a slow Umbraco site?
Start with the user-visible operation that is failing a requirement. For public delivery that may be server duration, TTFB, LCP or interaction latency. For editors it may be save, publish or search duration. Then decompose that measure into the dependencies that contribute to it.
Should every Umbraco site use output caching?
No. Cacheability depends on generation cost, freshness, authentication, personalization and invalidation. A cheap response may not need another cache layer, while a personalized response may need a different architecture.
Is Examine always faster than traversing content?
No. Examine is valuable for selective queries across a large published corpus. A small bounded traversal can be simpler and fast enough. The decision should follow the size, selectivity and frequency of the actual retrieval path.
Does upgrading Umbraco improve performance automatically?
Not necessarily. Newer platform versions can contain improvements, but an upgrade does not remove custom unbounded queries, repeated traversal, slow integrations or poor cache semantics. Verify performance independently.
How do I know whether to optimize SQL, Umbraco or the frontend first?
Measure the end-to-end symptom and identify the dominant cost. A slow page can have fast SQL and expensive application work, or a fast origin and a slow browser experience. Optimize the layer that explains the requirement you are missing.
Can infrastructure scaling fix an Umbraco performance problem?
Sometimes, when measurements show genuine CPU, memory, connection or throughput saturation. Scaling is a weak first response when requests are mostly waiting on remote dependencies or performing structurally unbounded work.
Should editor performance have its own budget?
Yes. Save, publish, search and tree operations are part of the operating cost of a content platform. They have different dependency paths from public rendering and should be measured against separate expectations.


